
America on the Move
2020 saw some of the most dramatic shifts in new mover behaviors in recent years, shedding interesting home mover data that will impact the market for years.
Many renters and owners held off on moving as the pandemic took root, and the uncertainty put many households’ plans on hold. As time passed, demand grew, not just for the traditional moving reasons, such as a new job in a different location or finding a larger house to accommodate a growing family, but for previously unfathomable considerations.
Nearly overnight, millions of Americans found themselves working from home, often while their children attended school online right next to them. With this, home became more of a refuge from the outside world than ever before while becoming less private as everyone, from coworkers to classmates, got a glimpse of the home and its inhabitants. Home was no longer a place to relax after work and to sleep. It became the place where nearly all aspects of life occurred, pushing many to look for someplace new.
As industry leaders in New Mover Marketing, Speedeon understands how important acting on these mover market changes can be. Speedeon partnered with Marketing IQ, a best in-class analytics and insights firm, to look at the evolution of mover activity and how the pandemic, in particular, has shifted mover behaviors.
Pent-Up Demand Leads to Record-Breaking Q4
Despite being a chaotic and unpredictable year for movers in 2020, the 4th quarter demonstrated that people are only willing to wait so long before moving or were forced to do so due to economic factors.
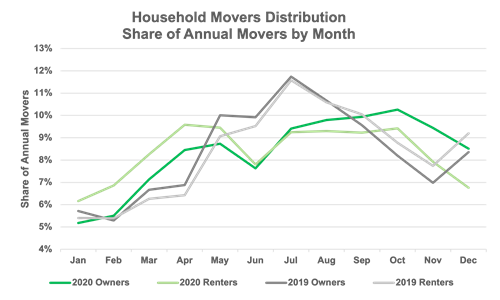
Traditionally, there is an increase in the number of households that move in the Spring, which peaks mid-Summer and tapers off into the Fall.
Much like in 2019, 2020 followed this pattern into May, when the impacts of the pandemic could first be felt due to the lease and home sales cycles. After a very slow summer, the fourth quarter saw a 42% increase in the share of annual household movers as compared to 2019.
Comparing 2019 to 2020, we saw very little change in the top states with the most movers. Still, this is largely due to the overall size of the population. When we take the number of households in the state into consideration, the results are not only quite different, but we see a major shift in 2020. In fact, none of the states with the highest number of movers as a percent of the overall household population are the same in 2020 when compared to 2019.
However, it is important to note that 87.9% of U.S. movers stayed within their state, except Washington D.C. which saw 53.3% of its movers leave the district, although 69.4% of them stayed in the metropolitan area (CBSA: Core Based Statistical Area) which was above the U.S. average of 64.9%.
Who is Moving?
A broad spectrum of households moved in 2020, often for very different reasons. From those unable to pay their rent to those looking for a home that doubles as a workplace, motivations may be different, but 2020 was by no means limited to any one segment of our society. Many macro trends that existed before 2020 continued, including which states had the greatest number of movers, but a closer look revealed major shifts are underway, some new and some accelerated by the pandemic.
While the top five states for total movers were exactly the same as in 2019 — when based on the household population — none of the top five were the same.
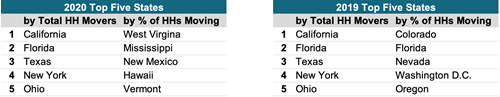
Analysis of Speedeon’s New Mover data showed that the total mover volume masked important trends in less populous states. States with smaller populations like Idaho, New Hampshire, and Montana all saw solid growth from movers in 2020, with many leaving New York, Massachusetts, and Illinois.
Home Mover Data: Interstate Movers
When comparing the number of households moving into a state to those leaving, Idaho led the pack with 1.52 households moving to the state for every one that left. At the other end of the spectrum, New York saw 1.84 households leave for each one that came to the state. It is important to note that the impacts are often reduced by the number of movers who stay within the state. These changes do not include non-mover-related population changes.
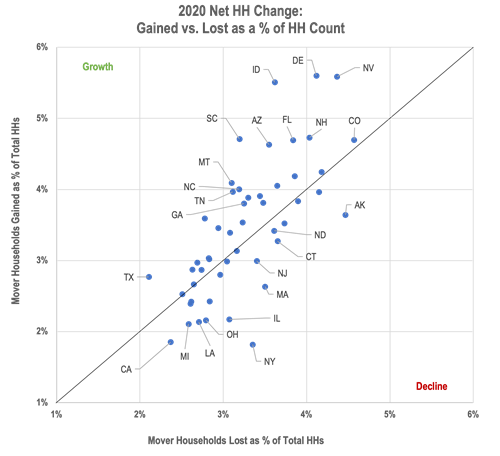
At the state level, when taking population into account, metropolitan areas saw very different mover concentrations in 2020.
Historically, markets near major military bases and universities have the highest percentage of households that move in a given year. However, this was not the case in 2020. Small markets with noticeable socio-economic challenges (high poverty and crime levels, low income, etc.) topped the list in 2020. Of the top five, only Zapata, TX gained households with the rest losing 1.5 to 2.0 households for each one they gained.
However, having a high percentage of households that moved was not indicative of a declining household population as the top five in 2019 were all flat or saw growth in 2020, indicating that the 2020 top movers as a percent of the household population represented a fundamental change.
Click here for a New Mover Data Product Overview
Where Are People Moving?
People are moving, but the story of where they are moving from and to changed significantly in the last year. And the data tells a very interesting story.
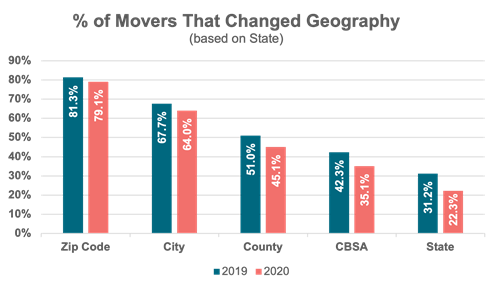
Movers in 2020 were far less prone to major changes in their living environment than in 2019. They made moves that kept them in the same general geographic location and in a neighborhood with a similar level of urbanization. While there was a trend to move out of more heavily urbanized environments, this trend was actually reduced compared to 2019.
According to our home mover data, households that moved in 2020 were more likely to stay in the same zip code, city, county, CBSA, and state when compared to the two previous years. Those who moved were looking for minor lifestyle changes or were forced to move. Moreover, they were 12% less likely to change counties and 29% less likely to change states than in 2019.
Movers in Washington D.C. and Delaware were most likely to change metropolitan areas. Those in Indiana and Ohio were least likely to make any kind of geographic change.
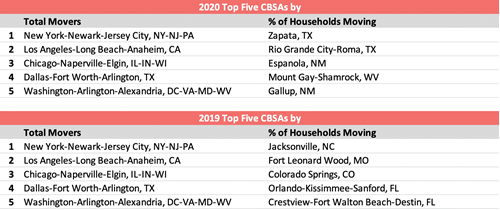
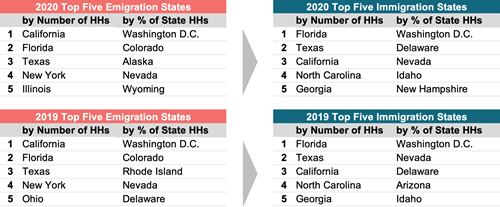
When comparing 2019 to 2020, there was little change in the top states that people left (emigration states), but this is largely due to the overall size of the population, and none of the top five states for total movers were the same.
Based on the percentage of households that moved, Washington D.C. and Colorado were the only constants between 2019 and 2020. Immigration states showed more consistency with four of the top five from 2019 appearing in 2020. Interestingly, Washington D.C. saw the highest emigration and immigration based on the percentage of households, demonstrating its high level of churn.
What is Happening at the Metropolitan Level (CBSA)
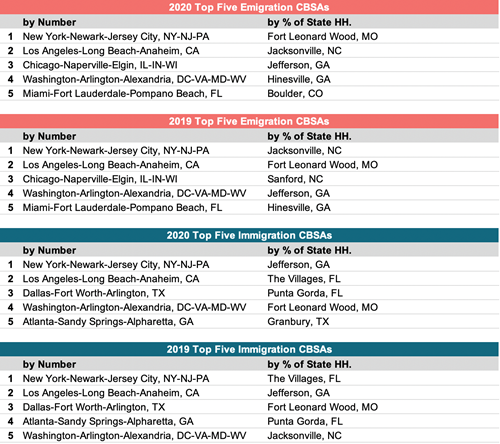
More interesting than state-level trends is what is happening at the metropolitan level (CBSA) and the types of environments that movers are choosing when moving, both of which have seen major changes since 2019.
While the top metropolitan areas households are leaving and their destinations are very similar year over year, these home mover data trends demonstrate a major population shift has been underway and the pandemic did little to slow it. One key example is the continued presence of Atlanta, GA as a top destination and the absence of the third largest city (Chicago, IL) from this list for several years.
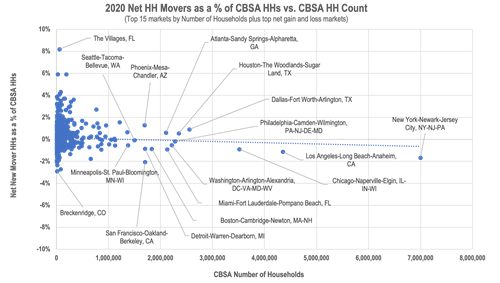
Are People Leaving the Big Cities?
In 2020, more households left eleven of the top fifteen largest metropolitan areas in the United States than they gained.
Fewer households are opting to move to cities such as New York, Los Angeles, Chicago, and San Francisco, as this trend started before the pandemic but has since accelerated. Conversely, Atlanta, Dallas, Houston, and Phoenix (the only four that saw increases) are all seeing a continuation of the growth trends they have enjoyed over the past few years.
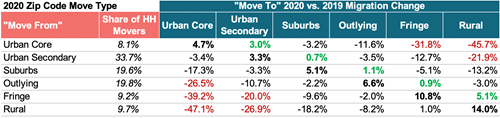
In 2019, 24.2% of movers relocated to more urbanized zip codes while 27.5% opted for more rural ones, with 48.4% staying in the same zip code or moving to a similar one. In 2020, only 22.1% moved to more urban zip codes while 26.6% moved to more rural ones and a larger share stayed in similar surroundings (51.2%). Looking at different levels of urbanization across different metro types, all but one (Rural to Fringe) saw year-over-year declines in migration rates to more urbanized environments.
While the data showed some year-over-year increases, home movers were more inclined to make moderate moves to slightly less urbanized areas, while major moves were far less likely. Compared to 2019, there was a subdued trend in moves to more rural areas.
Major moves from highly populated urban zip codes to rural ones and vice-versa declined 46% and 47%, respectively.
What Does the Future Hold?
The motivating factors behind mover behaviors will never be what they once were, as long-term population shifts continue and the pandemic brings on or accelerates a yet-to-be-determined level of permanent change.
As businesses implement more permanent remote policies that empower workers to live where they want, technology powerhouses move beyond Silicon Valley, and the amount of time spent at home finally starts to subside, what movers look for in a home will never be the same.
Keeping track of current and emerging trends will be key for marketers to accommodate the needs of this audience.
Click here for a New Mover Data Product Overview
For more information on the report, please submit inquiries to marketing@speedeondata.com. Interested in our new mover data and services? Feel free to contact us!
Stay in the know! We thought you’d find this articles related to home mover data interesting: