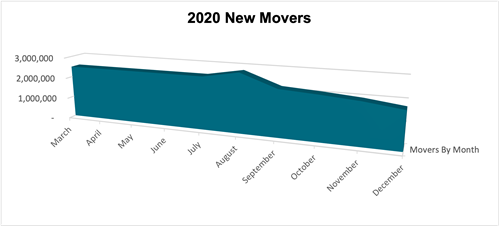
Despite American cities being in widespread lockdowns, consumers still moved in 2020, and the trend looks to continue into 2021.
Looking at our data from March 2020 until December 2020, we identified at least 2 million moves each month throughout the end of moving season last year, reaching as high at 2.8 million over the summer.
Even after the summer rush, the volume stayed high.

Despite initial concerns that move volume would dip during the pandemic, they remained constant and, in some cases, grew YoY.
- In March, move volume was up 25% YoY.
- The big shift here was existing home sales slumped, being propped up by new home sales leading into May – when lock downs started to take effect1.
- This trend continued into June2,3 before existing home sales rebounded into July to a 14-year high, up 27.4% from a year earlier4
- The rebound continued into August5 and September6 before dropping down at their seasonally expected rates7.
With one month down in 2021, and moving season right around the corner, you have an opportunity to connect with an incredibly reliable, responsive audience and drive real results for your brand. Check out our data cards and contact us today to get counts ran: New Mover Datacards
1) https://www.businessinsider.com/us-existing-home-sales-slump-to-9-12-year-low-2020-6
2) https://www.nar.realtor/blogs/economists-outlook/june-2020-existing-home-sales
3) https://www.advisorperspectives.com/dshort/updates/2020/07/22/existing-home-sales-climb-in-june
4) https://www.marketwatch.com/articles/new-home-sales-soar-to-14-year-high-as-supply-remains-tight-and-mortgage-rates-low-51598369657
5) https://www.nar.realtor/blogs/economists-outlook/august-2020-existing-home-sales-reach-highest-level-since-december-2006
6) https://www.nar.realtor/blogs/economists-outlook/september-2020-existing-home-sales-rise-to-6-5-million
7) https://www.cnbc.com/2020/11/19/october-existing-home-sales-see-spectacular-26point6percent-annual-increase.html

