
Not all college basketball fans are alike
March Madness buzz is building — the big tournament is finally here! Sports and data are a beautiful and natural combination. Both are filled with excitement, gasps, big moments, and lots and lots of statistical analysis. So as the data professionals that we are, we couldn’t miss out on some good profile analysis fun.
In other words, we began to wonder…how do the differences between teams extend beyond the court?
How do Alabama fans compare to Purdue? Which Texan fans are most likely to be planning a trip — Baylor, Houston, or Texas? Which fans are more likely to cheer on their favorite team from the neighborhood sports bar — or perhaps on a tablet at home? If fans shop during commercial breaks, are they more likely to shop for sports equipment or their next vacation?
There’s only one way to get the answers to these critical questions — to the Data! We turned to our Customer Intelligence Platform, AudienceMaker, to shape up a profile analysis of US basketball fans, and get answers to serious questions like “How are these fans going to watch the game?” AudienceMaker allowed us to pull these insights immediately with just a few clicks.
In this blog, we are going to share a few highlights, but we will also be sharing many more on LinkedIn. Make sure to follow us if you want to see all the fun stats and sports analytics as we roll them out for the teams still in the tournament.
Fan insights
The teams and their fans
While we may have our own predictions for who is going to make it to the Elite 8, or even the Final 4 (cough *Go Marquette* cough), we decided to conduct a quick profile analysis on fans of 17 different teams.
While we are very busy marketers, it only takes moments if using AudienceMaker, so why not? If you would like us to do a quick profile on your top customers, reach out!
- Alabama
- Arizona
- Baylor
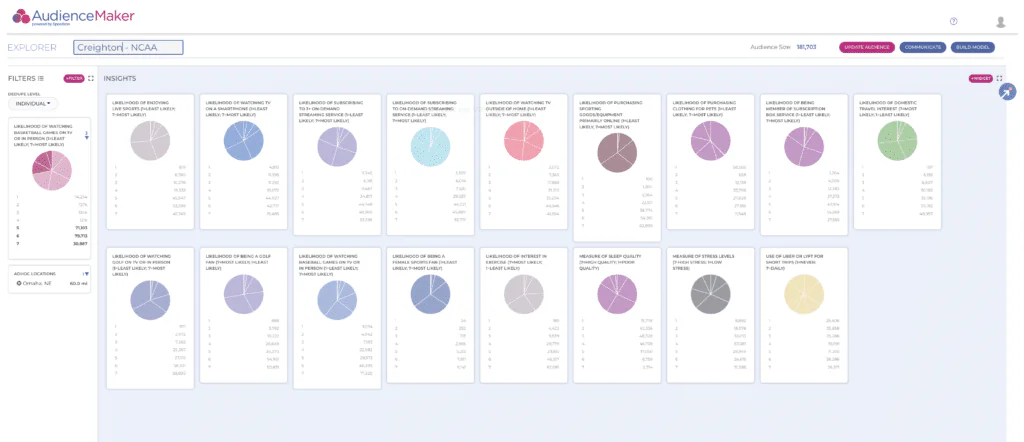
- Creighton
- Gonzaga
- Houston
- Kansas State
- Kansas
- Marquette
- Miami
- Purdue
- Tennessee
- Texas
- Texas A&M
- UCLA
- UConn
- Virginia
- Xavier
The data points
Although we have 1000+ data variables available, including consumer demographics, movers, real estate information, health, wealth and income, occupation, and interests, we steered clear of anything too sensitive and stuck to a few fun ones which may relate to watching the game, or the ads likely to be shown during breaks.
- Enjoys watching live sports
- Watched TV on a smartphone
- Subscribes to 3+ on-demand streaming services
- Subscribes to at least 1 streaming service
- Watches TV outside the home
- Purchases sporting goods and equipment
- Purchases Pet Clothing (I’m looking at you, Chief Product Officer)
- Subscribes to a monthly subscription box service
- Interested in Domestic Travel
- Watches Golf on TV
- Watches Baseball on TV
- Interested in Exercise
- Quality of sleep
- Stress levels
- Uses Uber or Lyft
Interesting differences in fans
Here are a few highlights we found interesting. Make sure to follow us on LinkedIn as we show comparisons between cities as they face off against each other on the court. Basically, we’ll give you the fuel to elevate your smack talk and infuse more statistics 🙂
-
- While both Kansas and Alabama have plenty of enthusiastic fans, Alabama fans are 91.4% more likely to enjoy live sports on TV over Kansas basketball fans.
- Out of all the teams, Baylor fans have the worst quality of sleep, with 44.1% of them highly unlikely to sleep well.
- Creighton fans were the most likely to watch sports live out of all teams (55.7%).
- Miami fans were the mostly likely to watch TV on their smartphones (45.8%)
- Baylor fans were the most likely to watch TV out of the home (EX: sports bar) with 62.8% of them highly likely to do so.
- Miami fans are the least likely fan group to buy their pet’s a jersey for the tournament. 48.9% of them were highly unlikely to buy pet clothing, the largest percentage across teams.
- Miami fans were however the group most likely to be a member of a subscription box service with 55.7% of their fans highly likely to get a subscription box.
- Texas fans were the most interested in domestic travel (59.9%) followed by KU fans (57.7%) and Creighton fans (57.3%).
- Creighton fans were the most likely to watch golf (64.9%) followed by Gonzaga fans (60.6%).
- Arizona fans are the most likely to use ride share services like Uber or Lyft with 74.6% of them highly likely to use them. Miami (71.3%) and UCLA (68.1%) were close behind.
Creating a profile analysis in an instant
As we mentioned before, we knocked out profiles of 18 different teams in less than 5 minutes each. Here is how we did it.
Identify the audience
In AudienceMaker, selecting your audience can be as simple as selecting your uploaded files of customers, selecting from our full taxonomy of third-party data points, or layering both together. To create this audience, we limited the geography to a radius around each college and included only basketball fans.
Identify the attributes that matter
Profile reports that give the same canned 10-20 attributes each time are fine…but wouldn’t it be more fun to configure your own custom profile report?
As an example, while most profile reports include variables like age, gender, income, marital status, etc, some brands may be much more interested to know how many of their customers are homeowners and how many are renters.
That’s one of the things we love about AudienceMaker — we can actually deliver a custom profile faster than a canned one. Once we had identified the audience we wanted to analyze, we scrolled through the taxonomy of data and clicked on the variables we wanted included.
Layering in first-party data for analytics
Analysis becomes even more fun when we layer in our customer’s first-party data. In fact, that’s the top use case for AudienceMaker users today!
Brand marketers simply upload their data file and then select it for analysis, modeling, and more. You can also use your own custom variables for future profile analysis and profile reports. As soon as the file is loaded, our system goes to work performing data hygiene and matching to ensure the file is in top shape for everything that follows.
Get a free analysis of your best audience
Reach out now to get a free profile of an audience of your choice. That may be an audience you have available (your own customer list, top prospects, etc) or an audience that you describe and we construct using our dataset. We love showing off our powerful Customer Intelligence Platform, even more than we enjoy playing in it. Let’s connect!